Reporting and decisions
How to Interpret A/B Test Results
★☆☆ Technical level 1 of 3
Written by Neil Webley · Last updated
Understand your A/B test report in plain English, including conversion rate, chance to beat control, statistical significance and when to choose a winner.
Early results can move around a lot. Use the whole report, allow enough time and check that the improvement would matter to your business before making a change permanent.
Start with the question your test was meant to answer
Before looking for a winning version, remind yourself why you ran the test. For example: “Will a clearer delivery message help more people complete a purchase?”
Next, look at the Primary KPI. This is the main action you chose to judge the test, such as a purchase, completed form or enquiry. Other figures can help explain what happened, but your primary KPI should lead the decision.
A simple example
Suppose the control and Variant 1 each receive 1,000 visitors:
| Version | Visitors | Purchasers | Purchase rate |
|---|---|---|---|
| Control | 1,000 | 50 | 5.0% |
| Variant 1 | 1,000 | 60 | 6.0%+1.0 percentage point |
Variant 1 produced ten more purchasers and its rate is higher than the control. That is encouraging, but there is still a reasonable chance that the difference happened through normal variation in who visited each version. A conventional significance check would not yet call this result statistically significant. The sensible answer is “promising, but keep collecting data”, not “we have a winner”.
Read the report from left to right
An A/B test report shows the control alongside each changed version. For every version, check:
- Visitors: how many people entered that version of the test.
- KPI users: how many of those people completed the action you are measuring.
- Rate: the percentage of visitors who completed that action.
- Chance to beat control: how likely the changed version is to do better than the original, based on the results so far.
- Statistical significance: whether the difference is strong enough that it is unlikely to be ordinary random variation.
You normally do not need to calculate these figures yourself. A/B testing tools calculate them from the visitor and conversion counts in the report.
How to use “Chance to beat control”
This figure is intended to be easy to read. A result of 80% means the report estimates an 80% chance that the variant performs better than the control, based on the data collected so far.
Some reports also show a range for the possible difference between the two rates. A wide range means the result is still uncertain. If that range includes both a loss and a gain, Variant 1 could still be worse or better than the control. Thresholds and labels vary between testing platforms, so check how the tool you use calculates this figure.
This figure is helpful, but it is not a promise about future performance. Check it alongside statistical significance, how long the test has run and whether the improvement is valuable.
How to use “Statistical significance”
Statistical significance helps answer: “Is this difference likely to be more than ordinary chance?” A commonly used threshold labels a result statistically significant when its p-value is below 0.05.
This does not mean the result is 95% certain to be a winner. It means the observed difference would be unusual if the two versions actually performed the same. That distinction is why chance to beat control and statistical significance should be treated as separate measures.
A report may withhold its significance calculation when either version has too few conversions or non-conversions. Reaching a tool's minimum calculation requirement does not mean the test is ready to stop.
When is it safe to make a decision?
Avoid stopping as soon as a changed version moves ahead. Results often rise and fall at the beginning of a test, and stopping on the first good-looking day can turn a temporary lead into a false winner.
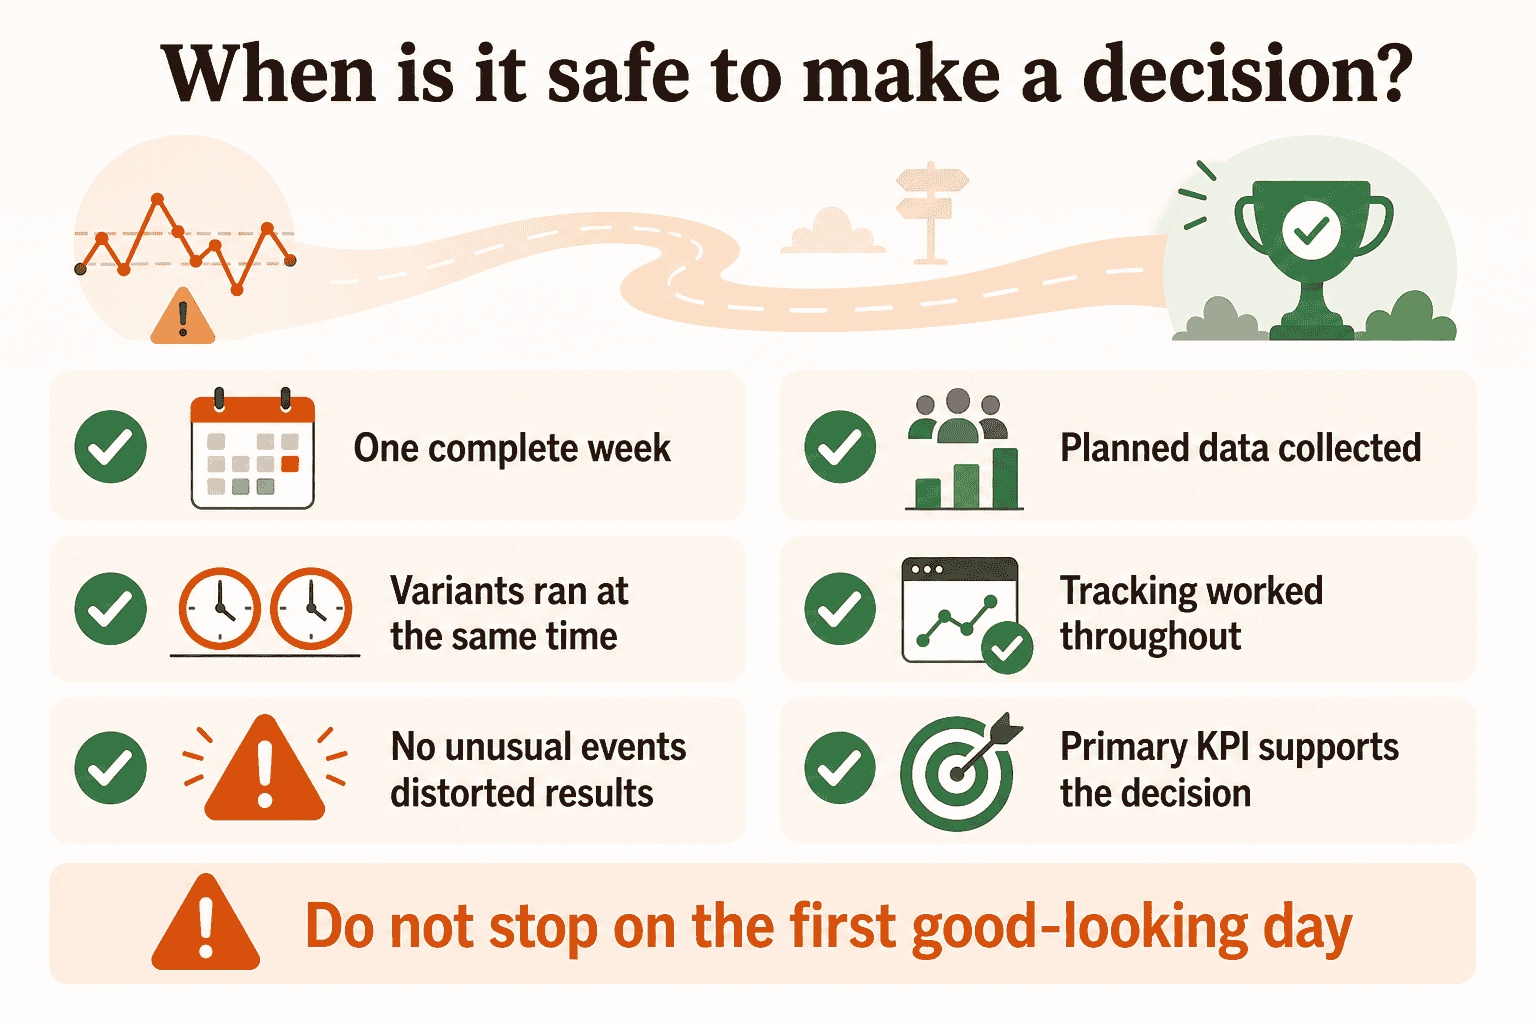
Before making a decision, check that:
- the test has covered at least one complete week;
- you have collected the amount of data you intended to collect;
- the original and changed versions ran at the same time;
- the test and its Google Analytics events worked correctly throughout;
- there was no unusual sale, outage or marketing campaign that distorted the result;
- the primary KPI supports the decision.
Seven days is a useful minimum safety check, not a promise that every test is complete after one week. Sites with fewer visitors and tests looking for smaller improvements usually need longer.
Would the improvement actually help the business?
A difference can be statistically convincing but too small to be worth implementing. The reverse is also possible: a large-looking improvement may be valuable, but the result may still be too uncertain to trust.
Ask what the change could mean for revenue, enquiries, costs and customer experience. Also consider the work and risk involved in making it permanent. A clear result and a worthwhile business outcome are both needed for a strong decision.
What should you do with the result?
The changed version is a convincing winner
Check that the test ran for long enough, tracking remained reliable and the improvement matters to the business. If those checks pass, make the change permanent and continue monitoring the main KPI.
The changed version performs worse
Keep the control. Look at the other KPIs for clues about why the change hurt performance, then use that learning to plan a better test.
There is no clear winner
This does not prove the versions are identical. You may need more visitors, or the real difference may simply be too small to detect or care about. Decide whether more testing time is worthwhile. If not, keep the simpler or safer version and record what you learned.
Reporting best practices
Handle ramp-up and throttled traffic consistently
You may want to leave the first few days out of your final analysis if the test was being ramped up, moved from staging to live, or had different tracking or traffic-allocation settings during that period. Decide this for a practical reason and record it; do not remove early data simply because you dislike the result. Throttling participation does not by itself make the data unreliable when visitors were still assigned randomly and tracking worked correctly.
A complete launch-day check in the live environment normally runs through the whole test and deliberately fires every configured conversion, including the primary KPI. These are known test actions rather than genuine customer outcomes, so they must be excluded from the final analysis. Record when live QA started and finished and remove the known test traffic when it can be identified reliably. If the report can only be filtered by date, or the QA events cannot be separated from real visitor activity, exclude the affected launch day and document why. This is especially important on lower-volume sites, where a handful of test KPI conversions could outweigh an entire day's genuine conversions.
Review device types together and separately
Start with the overall result, then compare desktop, tablet and mobile traffic separately. A change can be easy to use on desktop but awkward on a smaller screen, so the combined result may hide a useful difference. Treat unexpected device-level findings as clues to investigate unless you planned those comparisons before launch and each group has enough visitors and conversions. Looking at many small groups after a test increases the chance of finding a difference that happened by chance.
Record bugs, fixes and test changes
If you find a bug on a particular device, browser or screen orientation, record what was affected and the exact date and time the fix went live. The fix might exclude the affected device from the experiment or apply a different page change for that situation. Avoid changing a live test when possible, but if a correction is necessary, treat the period after the fix as a new stable period and analyse it separately. Do not mix results from before and after materially different implementations without accounting for the change.
Keep the same record for changes to targeting, traffic allocation, tracking and variant content. It gives you a clear reason for the reporting dates and audience filters you choose, rather than selecting a convenient window after seeing the result.
Understand uneven traffic splits
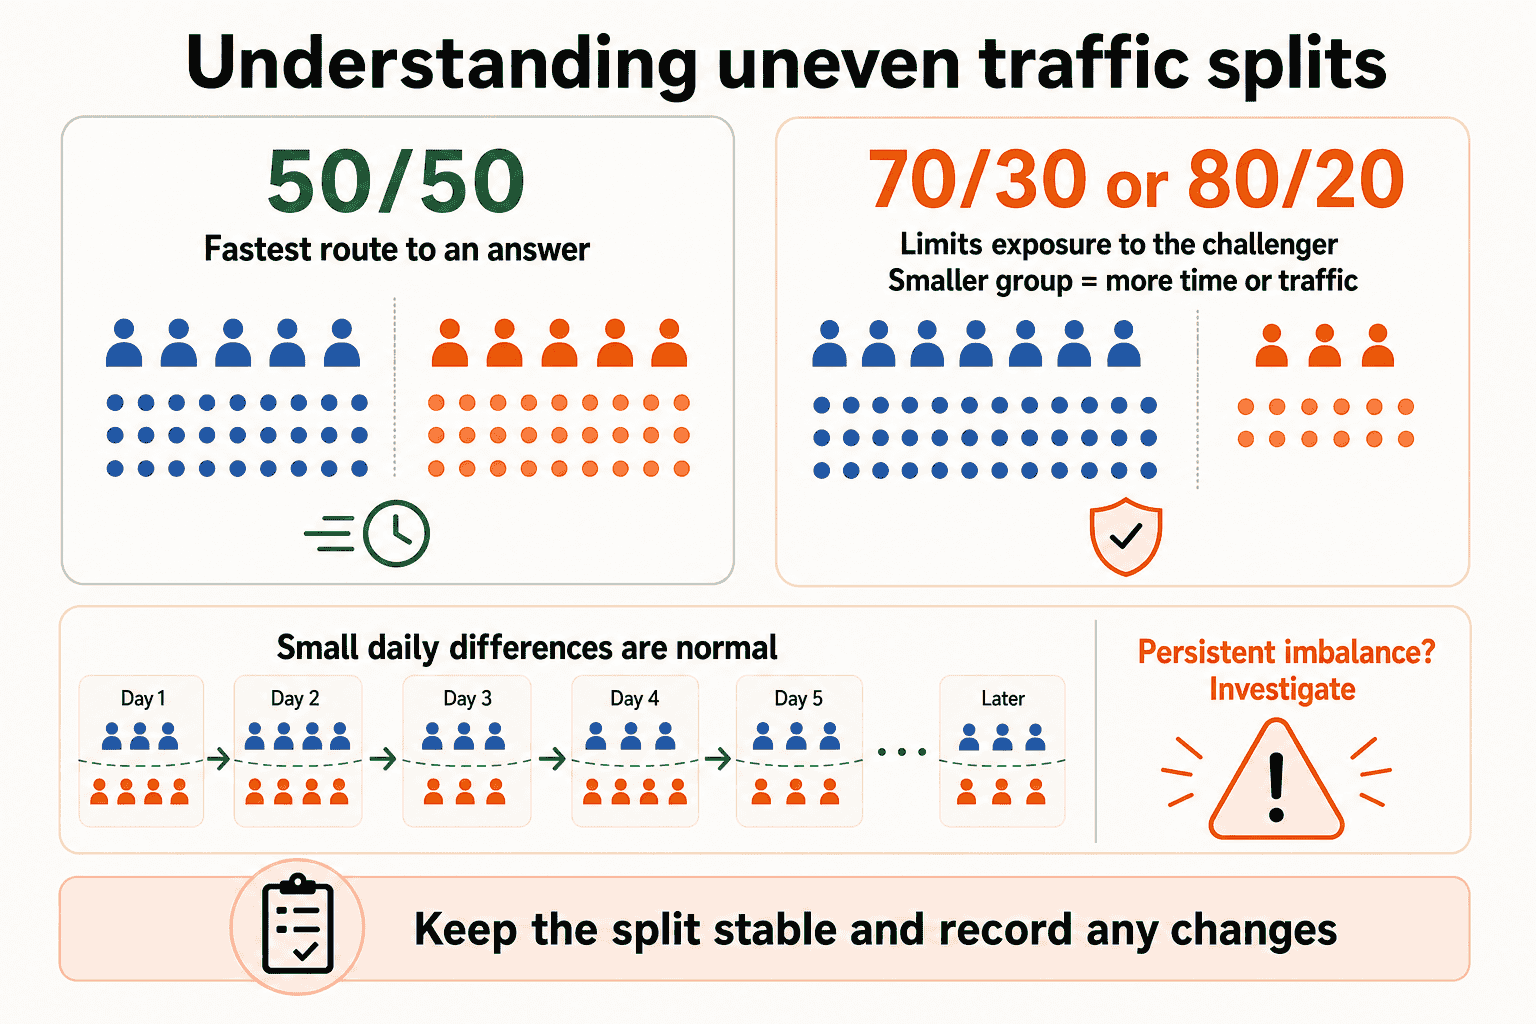
A 50/50 split usually reaches a useful answer most efficiently, but a 70/30 or 80/20 split can be sensible when you want to limit exposure to a riskier challenger. Uneven splits are valid: calculate each variant's conversion rate using its own visitors. The trade-off is that the smaller group gathers evidence more slowly, so the test will normally need more total traffic or more time.
Random assignment will rarely produce the exact requested split every day. Small differences are normal and should move closer to the intended balance as more visitors enter the test, especially on busy sites. Investigate a large or persistent imbalance because it can point to targeting, implementation or tracking issues. Avoid changing the split during a test; if you must change it, record the date and consider analysing the stable periods separately.
Make like-for-like comparisons
Compare the control and variants over the same dates and device groups. Include complete business cycles where possible, check that tracking stayed healthy, and avoid repeatedly changing the reporting window until a preferred result appears.
How FreeCROTool reports these results
The principles above apply whichever A/B testing platform you use. The following sections show how FreeCROTool turns the same visitor and conversion data into its Overview, Event details, Chart view and KPI results tabs.
Watch the reporting walkthrough
The video below follows a complete A/B test from account creation and tag installation through to launch and reporting with real visitor and conversion data. It starts here at the reporting section.
- 14:04 - A/B test reporting with real visitor and conversion data
- 14:14 - Comparing control and challenger conversion rates
- 14:40 - Daily and cumulative performance charts
- 15:03 - Chance to beat control and statistical significance
Watch the complete FreeCROTool tutorial on YouTube to see account creation, project setup, cookie consent, GA4 configuration, test creation, visual editing, conversion tracking, QA and launch.
The events behind the report
FreeCROTool sends clearly named events to Google Analytics 4. The event name tells FreeCROTool what happened, while the event's name value describes the particular page, click or purchase you chose to track.
freecro_impression
Impression
An impression means a visitor entered the test and was assigned to the control or a variant. FreeCROTool sends it with the name “visitor entered test”. Reports use these users as the visitor total and as the starting point for conversion-rate calculations.
freecro_click
Click tracking
A click event records that a visitor in the test clicked an element you chose to measure, such as the hero newsletter button. At present, click tracking configured in a visual editor test can only track clicks on the page being edited for that test.
freecro_page
Page tracking
A page event records that a visitor who entered the test reached a named page, such as a newsletter confirmation or an important article. This lets you measure outcomes that happen after the visitor leaves the original test page.
freecro_purchase
Purchase and revenue tracking
A purchase event records a completed transaction. It can include the transaction ID, currency and value. When this data is available, Event details can also show total revenue and average order value for each version.
freecro_custom
Custom conversion tracking
A custom conversion records an outcome that needs extra business logic rather than a simple page or click rule. For example, a developer could report visitors acquired through a particular channel separately from the overall audience. To report revenue for a particular product or category, custom logic can fire a specifically named purchase event only when the qualifying item was bought.
These conversions are generally added to developer-built tests because the code may need to inspect order data, attribution details or cookies. FreeCROTool only sends the conversion when that visitor has already entered the test, so the developer must implement and QA the conditions carefully.
What the Overview tab tells you
The Overview table checks whether visitors were shared between the control and challenger as intended. Look at the daily figures as well as the total: small samples can be uneven on individual days even when assignment is working normally.
View the full example Overview table
| Date | Control | Hero Newsletter Button | Split balance ⓘ | |||
|---|---|---|---|---|---|---|
| Visitors | Split % | Visitors | Split % | Avg dev % | Ideal split % | |
| 06/08/2026 | 0 | 0.0% | 1 | 100.0% | 50.0% | 50.0% |
| 09/08/2026 | 4 | 44.4% | 5 | 55.6% | 5.6% | 50.0% |
| 12/08/2026 | 2 | 22.2% | 7 | 77.8% | 27.8% | 50.0% |
| 13/08/2026 | 5 | 35.7% | 9 | 64.3% | 14.3% | 50.0% |
| 14/08/2026 | 5 | 50.0% | 5 | 50.0% | 0.0% | 50.0% |
| 15/08/2026 | 4 | 44.4% | 5 | 55.6% | 5.6% | 50.0% |
| 16/08/2026 | 3 | 33.3% | 6 | 66.7% | 16.7% | 50.0% |
| 17/08/2026 | 4 | 50.0% | 4 | 50.0% | 0.0% | 50.0% |
| 18/08/2026 | 5 | 50.0% | 5 | 50.0% | 0.0% | 50.0% |
| Total | 32 | 40.5% | 47 | 59.5% | 9.5% | 50.0% |
| All variants | 79 visitors | |||||
In this example, the intended split is 50% for each version. The final 40.5% versus 59.5% split is not perfectly even, so it is worth checking the traffic balance and keeping the different visitor totals in mind when reading conversions. FreeCROTool's conversion rates use each version's own visitor count, rather than comparing conversion counts alone.
What the Event details tab tells you
Event details lists every tracked outcome and shows the number of users and conversion rate for each version. The date range at the top controls the period included in this table.
Date range: 21/05/2026 to 18/08/2026
View the full example Event details table
| Name | Total | Control | Hero Newsletter Button | ||
|---|---|---|---|---|---|
| Users | Conv % | Users | Conv % | ||
| Visitors | 79 | 32 | - | 47 | - |
| test_1_page_newsletter | 19 | 5 | 15.63 | 14 | 29.79 |
| test_1_Clicked_Hero_Newsletter | 15 | 0 | 0.00 | 15 | 31.91 |
| test_1_page_fiona | 2 | 1 | 3.13 | 1 | 2.13 |
| test_1_page_lynda | 4 | 1 | 3.13 | 3 | 6.38 |
| test_1_page_lyndas_chocolatechipcookies | 1 | 0 | 0.00 | 1 | 2.13 |
| test_1_page_lyndas_panackelty | 2 | 1 | 3.13 | 1 | 2.13 |
| test_1_page_ourregion | 15 | 6 | 18.75 | 9 | 19.15 |
| test_1_page_paula | 6 | 2 | 6.25 | 4 | 8.51 |
| test_1_page_paulas_parmos | 17 | 7 | 21.88 | 10 | 21.28 |
FreeCROTool makes the single highest conversion rate in each event row bold. That may be the control or the challenger. Bold text is a quick comparison aid, not proof of a winner: always check the visitor volumes, the size of the difference and the KPI results before acting.
Use Chart view to see how results developed
Chart view creates a chart for each conversion configured in the test. Switch between daily values to see movement and unusual days, and cumulative running totals to see how the result developed over the full period. A smooth cumulative line can be reassuring, but it does not replace the statistical checks.
Set the KPIs and read the final comparison
Open the KPI results tab and use KPI settings to choose the primary KPI and, if useful, secondary KPIs. This tab is where FreeCROTool shows chance to beat control, the interval for the rate difference, statistical significance and the p-value for each variant compared with the control.
You can set the report start and end dates and view desktop, tablet and mobile visitors together or in isolation. FreeCROTool applies the selected reporting period and device group to the report tables, daily or cumulative charts, chance to beat control and statistical significance calculations. This lets you leave out a documented ramp-up period or inspect a device-specific result while keeping each comparison consistent.
FreeCROTool colours chance to beat control green at 95% or above when there is sufficient data. It shows statistical significance only after both the control and variant have at least five KPI users and five visitors who did not complete the KPI, and it warns against declaring a winner when the result covers fewer than seven different days.
Glossary: what the report terms mean in FreeCROTool
Control
The original version used as the comparison point. In FreeCROTool reports this is normally Variant 0.
Variant
A changed version shown to part of the test audience. FreeCROTool compares each variant with the control.
Primary KPI
The main action used to judge the test. You select the event used for this KPI in FreeCROTool's KPI settings.
Secondary KPI
An additional action that helps explain visitor behaviour. It can provide useful context, but it should not replace the primary KPI simply because it produced a more attractive result.
Visitors
The users FreeCROTool can identify as having entered each version of the test. The report uses the test-entry impression event recorded through Google Analytics.
KPI users
The users who triggered the Google Analytics event selected for that KPI. FreeCROTool counts users rather than treating every repeated event as a different person.
Rate
KPI users divided by visitors for that version. FreeCROTool displays the result as a percentage.
Uplift
The relative improvement compared with the control. Moving from 5% to 6% is an increase of one percentage point and a relative uplift of 20%.
Chance to beat control
FreeCROTool's estimate of how likely a variant's rate is to be higher than the control's rate. Behind the scenes, it uses a Bayesian calculation based on the successes and non-successes in each version. The report highlights at least 95% in green when there is sufficient data.
95% interval for the rate difference
A range showing the uncertainty around the estimated difference between the variant and control. FreeCROTool displays it in percentage points. Narrower ranges mean a more precise estimate; a range that crosses zero still allows for either a loss or a gain.
Statistical significance
A check of whether the difference is unlikely to be ordinary random variation. FreeCROTool uses a two-sided, two-proportion z-test and labels the comparison significant when p is below 0.05.
p-value
A number produced by the statistical-significance check. In simple terms, a smaller number means the result would be more unusual if there were no real difference. FreeCROTool uses p < 0.05 as its significance threshold.
Two-sided test
A check that can detect whether a variant is either better or worse than the control. FreeCROTool does not assume in advance that a change can only help.
A quick checklist
- Start with the primary KPI.
- Check that the visitor and KPI-user numbers look believable.
- Compare the rates and the size of the difference.
- Read chance to beat control and its range.
- Read the statistical-significance result.
- Make sure the test ran long enough and tracking worked correctly.
- Decide whether the likely improvement is worthwhile.
- Record the decision and what you learned.
If you have not configured the events behind your KPI yet, start with sending custom GA4 events from an A/B test. For the wider reporting approach, see FreeCROTool reporting and analysis.